目次
Streamlitとは

- Streamlit データアプリを構築して共有する最速のツール
- Pythonを書くだけで、ウェブアプリが簡単に構築できる
- Sharing • Streamlit を使うと簡単にウェブアプリ(比較的動作が軽いもの)を無料で公開できる(GitHubとの連携が必要)
サンプルウェブアプリ
Streamlitの環境構築
- Windows10での構築
- Anaconda Navigator で Python3.8の環境を用意
- GitHub で公開レポジトリを作成 streamlit-testというレポジトリ
- Windows10のマシンにチェックアウト
- Anaconda Navigator Python3.8の環境でコマンドプロンプト(ターミナル)を起動
- チェックアウトした streamlit-test に移動
- コマンドプロンプトで、下記のコマンドを実行
(Streamlit_py38) pip install streamlit
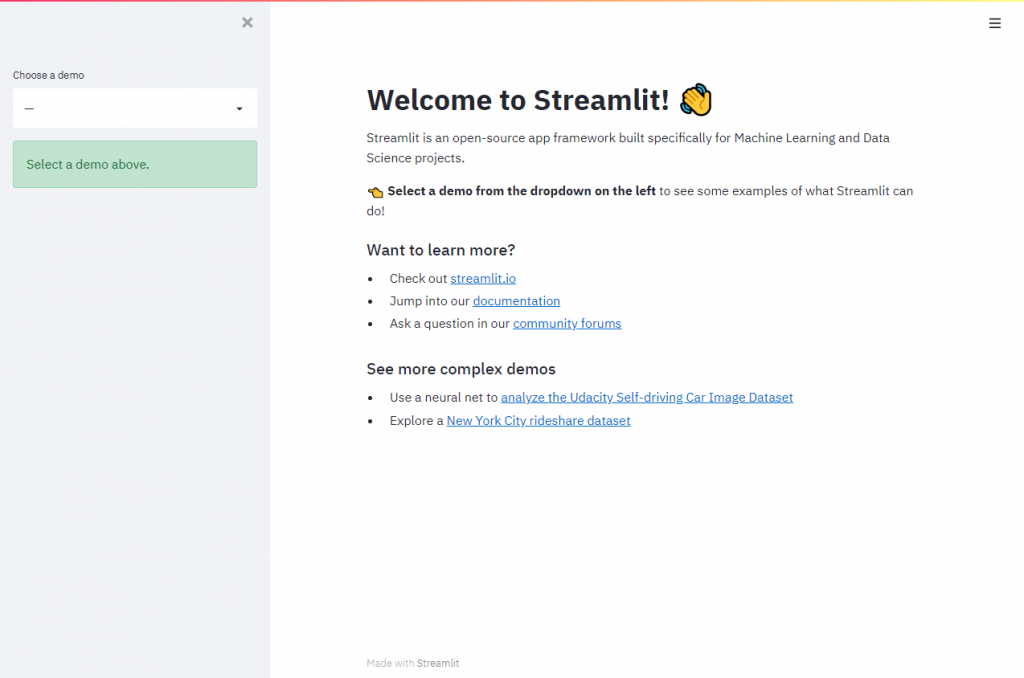
(Streamlit_py38) streamlit hellolocalhostで、案内・デモページが表示される
サンプルウェブアプリのコーディング
- 上記の 案内・デモページ は、コマンドプロンプトの「Ctrl」+「C」で終了。
- streamlit-testの階層に、st_app.py というPythonコードを作成します。
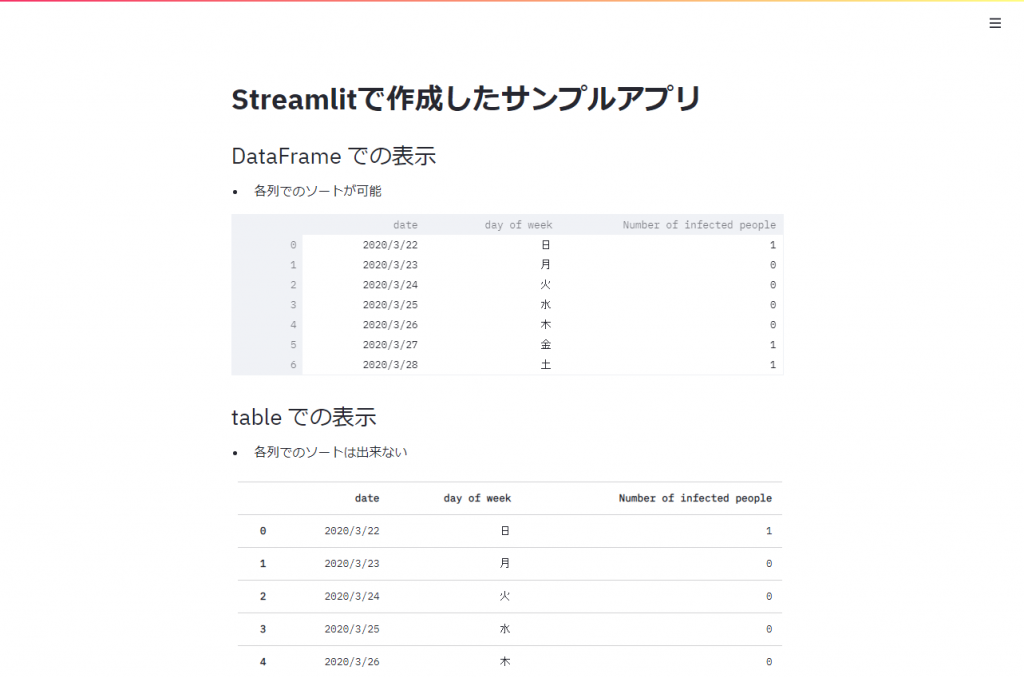
下記のコードで、Streamlitで作成したサンプルアプリ の「DataFrame での20列、50行の数値のランダム生成表示」の項目が作成されます。
import streamlit as st
import pandas as pd
import numpy as np

# DataFrame の表示
st.markdown('## DataFrame での20列、50行の数値のランダム生成表示')
st.markdown('- 読み込むごとに数値をランダムに生成')
st.markdown('- 各列でのソートが可能')
df = pd.DataFrame(
    np.random.randn(50, 20),
    columns=('col %d' % i for i in range(20)))
st.dataframe(df) 下記のコードで、Streamlitで作成したサンプルアプリ の「Plotly を使ったグラフ表示」の項目が作成されます。
import streamlit as st
import plotly.graph_objs as go

# Plotly の表示
st.markdown('## Plotly を使ったグラフ表示')

animals = ['鳥取県', '島根県', '岡山県', '広島県', '山口県']
populations = [4, 9, 83, 160, 55]

fig = go.Figure(data=[go.Bar(x=animals, y=populations)])

fig.update_layout(
    xaxis = dict(
        tickangle = 0,
        title_text = "都道府県",
        title_font = {"size": 20},
        title_standoff = 25),
    yaxis = dict(
        title_text = "感染者数",
        title_standoff = 25),
    title ='2021/05/24 中国5県の感染者数')

st.plotly_chart(fig, use_container_width=True)
streamlit-testの階層で、コマンドプロンプトにて「streamlit run st_app.py」を実行すると、localhostのブラウザで、作成したウェブアプリが確認できます。このようにPythonコードを書くだけで、簡単にウェブアプリが作成出来ます。
次回は、Sharing • Streamlit を使ったウェブアプリの公開手順を記載します。